Introduction
Calculation
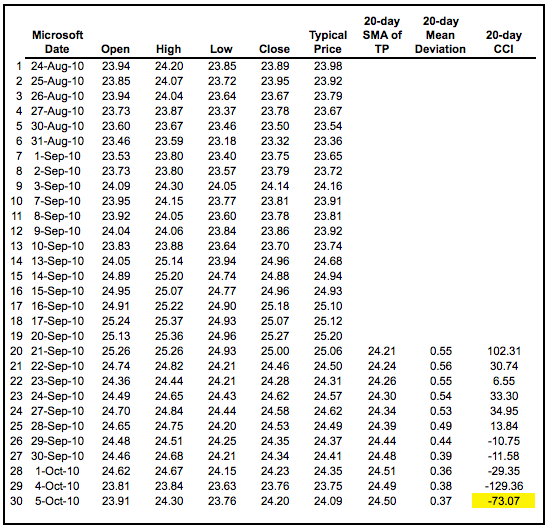
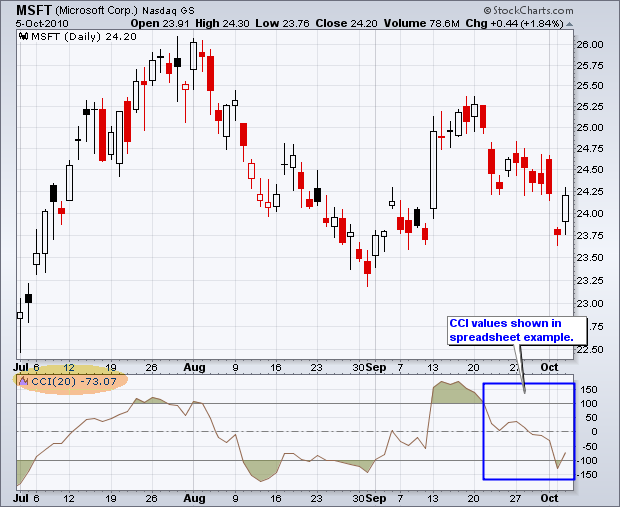
The example below is based on a 20-period Commodity Channel Index (CCI) calculation. The number of CCI periods is also used for the calculations of the simple moving average and Mean Deviation.Lambert set the constant at .015 to ensure that approximately 70 to 80 percent of CCI values would fall between -100 and +100. This percentage also depends on the look-back period. A shorter CCI (10 periods) will be more volatile with a smaller percentage of values between +100 and -100. Conversely, a longer CCI (40 periods) will have a higher percentage of values between +100 and -100.
Interpretation
The Commodity Channel Index (CCI) can be used as either a coincident or leading indicator. As a coincident indicator, surges above +100 reflect strong price action that can signal the start of an uptrend. Plunges below -100 reflect weak price action that can signal the start of a downtrend.
As a leading indicator, chartists can look for overbought or oversold conditions that may foreshadow a mean reversion. Similarly, bullish and bearish divergences can be used to detect early momentum shifts and anticipate trend reversals.
New Trend Emerging
As noted above, the majority of CCI movement occurs between -100 and +100. A move that exceeds this range shows unusual strength or weakness that can foreshadow an extended move. Think of these levels as bullish or bearish filters. Technically, CCI favors the bulls when positive and the bears when negative. However, using simple zero-line crossovers can result in many whipsaws. Although entry points will lag more, requiring a move above +100 for a bullish signal and a move below -100 for a bearish signal reduces whipsaws.
The chart below shows Caterpillar (CAT) with 20-day CCI. There were four trend signals within a seven-month period. Obviously, a 20-day CCI is not suited for long-term signals; chartists should use weekly or monthly charts for those. The stock peaked on 11-Jan and turned down. CCI moved below -100 on 22-January (8 days later) to signal the start of an extended move. Similarly, the stock bottomed on 8-February and CCI moved above +100 on 17-February (6 days later) to signal the start of an extended advance. CCI does not catch the exact top or bottom, but it can help filter out insignificant moves and focus on the larger trend.
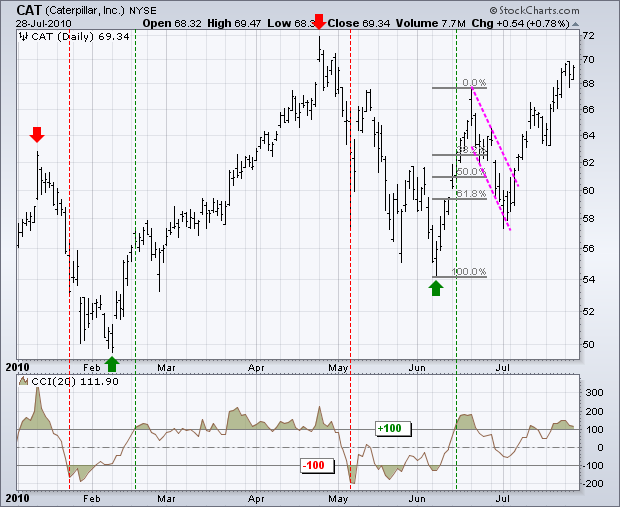
CCI triggered a bullish signal when CAT surged above 60 in June. Some traders may have considered the stock overbought and the reward-to-risk ratio unfavorable at these levels. With the bullish signal in force, the focus would have been on bullish setups with a good reward-to-risk ratio. Notice that the stock retraced around 62% of the prior advance and formed a falling flag by the end of June. The subsequent surge above the flag trend line provided another bullish signal with CCI still in bull mode.
Overbought/Oversold
Identifying overbought and oversold levels can be tricky with the Commodity Channel Index (CCI), or any other momentum oscillator for that matter. First, CCI is an unbound oscillator. Theoretically, there are no upside or downside limits. This makes an overbought or oversold assessment subjective. Second, securities can continue moving higher after an indicator becomes overbought. Likewise, securities can continue moving lower after an indicator becomes oversold.
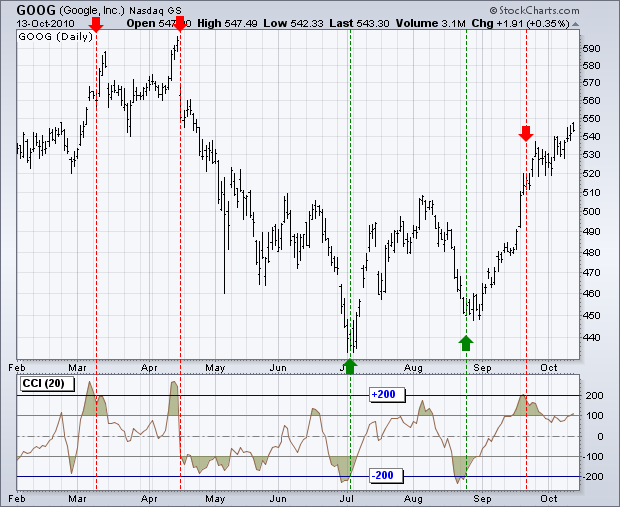
The definition of overbought or oversold varies for the Commodity Channel Index (CCI). ±100 may work in a trading range, but more extreme levels are needed for other situations. ±200 is a much harder level to reach and more representative of a true extreme. Selection of overbought/oversold levels also depends on the volatility of the underlying security. The CCI range for an index ETF, such as SPY, will usually be smaller than for most stocks, such as Google.The chart above shows Google (GOOG) with CCI(20). Horizontal lines at ±200 were added using the advanced indicators options. From early February to early October (2010), Google exceeded ±200 at least five times. The red dotted lines show when CCI moved back below +200 and the green dotted lines show when CCI moved back above -200. It is important to wait for these crosses to reduce whipsaws should the trend extend. Such a system is not foolproof, however. Notice how Google kept on moving higher even after CCI became overbought in mid-September and moved below -200.
Bullish/Bearish Divergences
Divergences signal a potential reversal point because directional momentum does not confirm price. A bullish divergence occurs when the underlying security makes a lower low and CCI forms a higher low, which shows less downside momentum. A bearish divergence forms when the security records a higher high and CCI forms a lower high, which shows less upside momentum. Before getting too excited about divergences as great reversal indicators, note that divergences can be misleading in a strong trend. A strong uptrend can show numerous bearish divergences before a top actually materializes. Conversely, bullish divergences often appear in extended downtrends.Confirmation holds the key to divergences. While divergences reflect a change in momentum that can foreshadow a trend reversal, chartists should set a confirmation point for CCI or the price chart. A bearish divergence can be confirmed with a break below zero in CCI or a support break on the price chart.
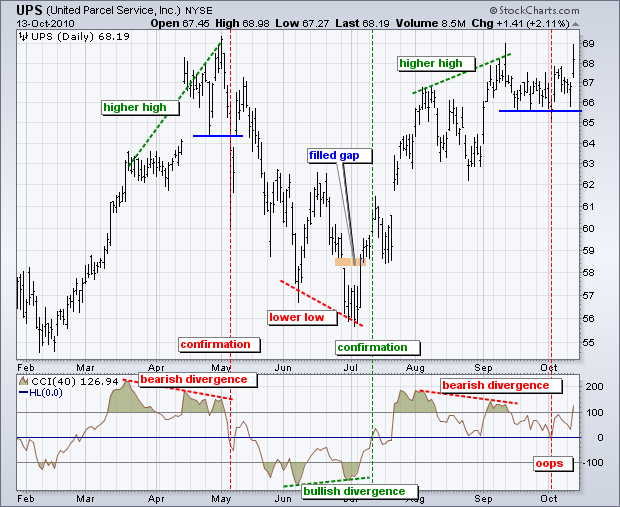
The chart above shows United Parcel Service (UPS) with 40-day CCI. A longer timeframe, 40 versus 20, was used to reduce volatility. There are three sizable divergences over a seven-month period, which is actually quite a few for just seven months. First, UPS raced to new highs in early May, but CCI failed to exceed its March high and formed a bearish divergence. A support break on the price chart and CCI move into negative territory confirm this divergence a few days later. Second, a bullish divergence formed in early July as the stock moved to a lower low, but CCI formed a higher low. This divergence was confirmed with a CCI break into positive territory. Also notice that UPS filled the late June gap with a surge in early July. Third, a bearish divergence formed in early September and was confirmed when CCI dipped into negative territory. Despite a CCI confirmation, price never broke support and the divergence did not result in a trend reversal. Not all divergences produce good signals.
Conclusion
CCI is a versatile momentum oscillator that can be used to identify overbought/oversold levels or trend reversals. The indicator becomes overbought or oversold when it reaches a relative extreme. That extreme depends on the characteristics of the underlying security and the historical range for CCI. Volatile securities are likely to require greater extremes than docile securities. Trend changes can be identified when CCI crosses a specific threshold between zero and 100. Regardless of how CCI is used, chartists should use CCI in conjunction with other indicators or price analysis. Another momentum oscillator would be redundant, but On Balance Volume (OBV) or the Accumulation Distribution Line can add value to CCI signals.Using with SharpCharts
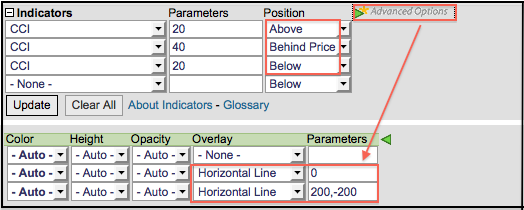
CCI is available as a SharpCharts indicator that can be placed above, below or behind the price plot of the underlying security. Placing CCI directly behind the price makes it easy to compare indicator movements with price movements. The default setting is 20 periods, but this can be adjusted to suit analysis needs. A shorter timeframe makes the indicator more sensitive, while a longer timeframe makes it less sensitive. Members can click the green arrow next to “advanced options” to add horizontal lines to mark overbought or oversold levels. Two lines can be added by separating the numbers with a comma (200,-200). Click here for a live example.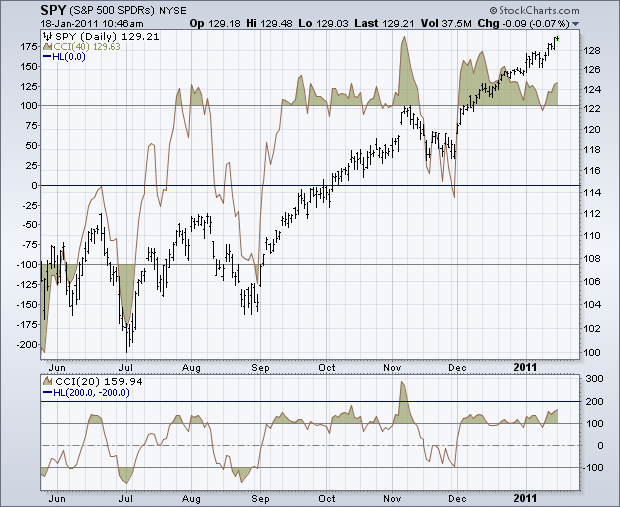
Suggested Scans
CCI Oversold in Uptrend
This scan reveals stocks that are in an uptrend with oversold CCI turning up. First, stocks must be above their 200-day moving average to be in an overall uptrend. Second, CCI must cross above -200 to show the indicator rising from oversold levels.[type = stock] AND [country = US]
AND [Daily SMA(20,Daily Volume) > 40000]
AND [Daily SMA(60,Daily Close) > 20]
AND [Daily Close > Daily SMA(200,Daily Close)]
AND [Daily CCI(20) crosses -200]
CCI Overbought in Downtrend
This scan reveals stocks that are in a downtrend with overbought CCI turning down. First, stocks must be below their 200-day moving average to be in an overall downtrend. Second, CCI must cross below +200 to show the indicator falling from overbought levels.[type = stock] AND [country = US]
AND [Daily SMA(20,Daily Volume) > 40000]
AND [Daily SMA(60,Daily Close) > 20]
AND [Daily Close < Daily SMA(200,Daily Close)]
AND [200 crosses Daily CCI(20)]
For more details on the syntax to use for CCI scans, please see our Scanning Indicator Reference in the Support Center.
Further Study
John Murphy's Technical Analysis of the Financial Markets has a chapter devoted to momentum oscillators and their various uses. Murphy covers the pros and cons as well as some examples specific to the Commodity Channel Index.Martin Pring's Technical Analysis Explained presents the basics of momentum indicators by covering divergences, crossovers and other signals. There are two more chapters covering specific momentum indicators with plenty of examples.
CCI运用原则:
买点:CCI从+100~-100的常态区,由下往上突破+100天线时,为抢进时机。
买点:CCI从-100地线下方,由下往上突破-100地线时,买进股票。
卖点:CCI从+100天线之上,由上往下跌破天线时,为加速逃逸时机。
卖点:CCI从+100~-100的常态区,由上往下跌破-100地线时,为放空卖出时机。
CCI顺势指标的使用技巧:
一、CCI短线强势买入法
当CCI指标由下向上突破+100天线时,立即买入。强者恒强,不要担心所选个股已经有较大的涨幅。但应符合以下条件:
1.不能跳水。判断大盘当日和次日不能为大幅跳水行情。
2.成交量增。所选个股量比为2以上或换手率为3%以上。
3.涨停基因。年内有过连续两个涨停或三日涨幅超过20%的。
4.中小盘股。流通股本小于10亿的。
5.无负消息。近期没有减持、解禁、业绩下滑、诉讼等利空消息的。
6.上升浪。非5浪运行结束的,最好选在主升浪3浪或调整的B浪上。
7.上穿有力。CCI指标线上穿有力的,如果软弱无力最好不要介入。
8.买盘大于卖盘。内外比小于1的,大单买入数量多于大单卖出数量的。
9.周线上穿。周线CCI上穿100天线时,按日线CCI买入成功率更高。
买入方法:
1.如果开盘半小时后,判断大盘高走,可在上午10时后买入;
2.如果大盘半小时后,判断大盘震荡,并经运行证实,可在下午2:30后判断大盘,尾盘不会跳水时,实施买入。
3.如果大盘半小时后,判断大盘震荡,但实际运行出现大幅上涨趋势,也可椐情买入。
卖出方法:
1.指标线一直在+100上方,且没有出现向下折回现象,继续持有。
2.指标线出现向下折回,但折回不深,距+100天线较远,且大盘没有出现跳水,继续持有;
3.指标线折回距+100天线很近或跌破,卖出;
4.次日出现大盘跳水或指标线折回跌破100天线,及时获利或割肉出局。
5.日线出现放量大阴线或十字星卖出。
如爱仕达:
二、CCI底部买入法
当CCI顺势指标由下向上突破-100线时,表明股价的探底阶段可能结束,将进入一个盘整或上升阶段,可逢低少量买入股票。具体选股与操作方法如下:
1.CCI顺势指标一次探底买入。应选择强势上涨之后,调整ABC结束的个股。
如冠昊生物:
2.CCI顺势指标二次或三次探底买入。
当股价充分调整,CCI出现二次探底,形成一个W底时,可在上穿-100地线时买入。如沙隆达A:
3.CCI顺势指标背离买入。
在CCI顺势指标线已经一次或多次CCI跌到-100下方折回后,当股价继续下跌时,CCI顺势指标虽然又跌至-100下方,但下探深度低于前面,出现了CCI两底连线方向向上,与股价的连线向下方向相反的背离情况,可以在上穿-100地线时买入。恒源煤电:
三、30分钟CCI顺势指标买入法
在尾盘收盘前,运用30分钟的CCI顺势指标,选择远离-100的,并开始迅速向上的,当快接近-100时候,立即买入。
第二天,在剩下的8个30分钟周期向上跑的概率极大,甚至有上穿+100的可以。这8个30分钟周期足够你逃跑的了。
当然在对第二天大盘有向上的基本判断的情况下操作。
四、高量比买入法
在判断大盘是可以建仓的情况下,对于量比大于4的个股,且CCI具备强势买入法和底部买入法要求的个股进行选择。条件如下:
1.换手率达3%以上的;
2.流通股票10亿以下的;
3.内外比小于1的;
4.处于上涨状态但涨幅不超过5%以上的;
5.始终在分时线均线上方平稳运行的;
6.大单买进大于大单卖出的;
7.最好是可能成为当日热点板块的等。
选股方法
在3000多只股票中,如果选出适合使用CCI顺势指数的个股,现在介绍一种方法:
1.选出一年内有过连续涨停或连续涨幅较大的个股,存入自选。
2.用软件中的标记,逐个标出不同阶段的个股。如,(绿字)即向上突破0轴的、突破100天线的、突破100天线后折回但没有跌破100天线的;(粉字)跌破100天线但没有跌破0轴的;(红字)跌破0轴的、跌破-100地线的、上穿-100地线但没有上穿0轴的。
3.每天观察及量比大于2的、内外比小于1的个股,并盘中及时或盘后根据个股CCI指标变化情况,重新标注。
4.将符合介入条件的,放在自选前例。
5.把每日涨停个股中,符合条件的个股,纳入自选并标注。
还是那句话没有不好的股票,只有不好的操作,操作不好的朋友看下笔者近期的操作记录:
5月11号提示的002397梦洁股份,8个交易日收益高达98%
5月15号提示持有的的000557西部创业,短短5个交易日收获47%
5月19号讲过的600599熊猫金控,3个交易日获得33%
